Explore your data.
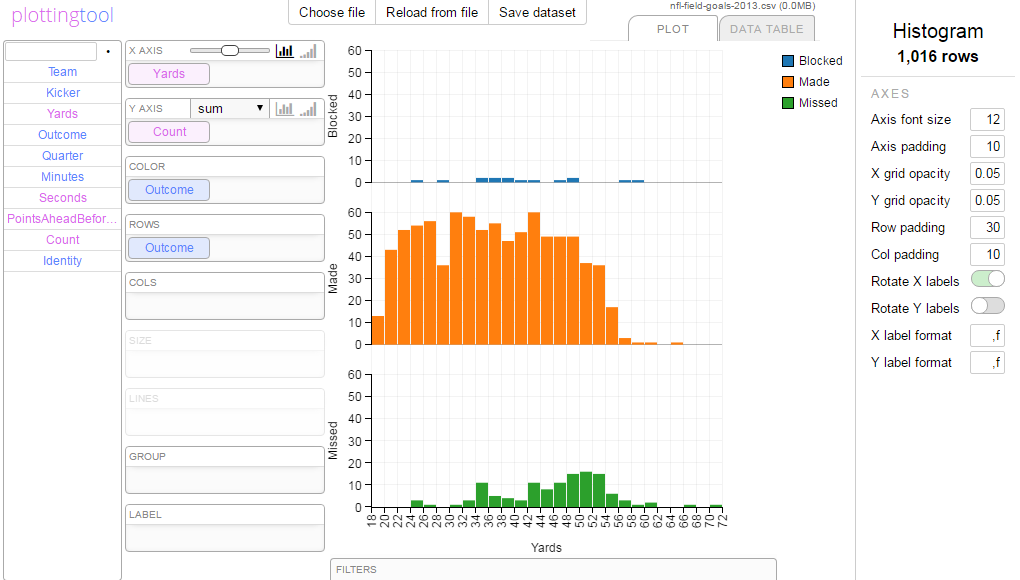
Quickly assemble and change your visualization with drag-and-drop. Drag dataset columns onto dimension "trays" to build a chart.
Bar charts, line charts, histograms, subplots, scatter plots - PlottingTool supports most standard charts and lets you fluidly switch between them.
The app runs completely locally, in your browser tab. Your data never leaves your computer.
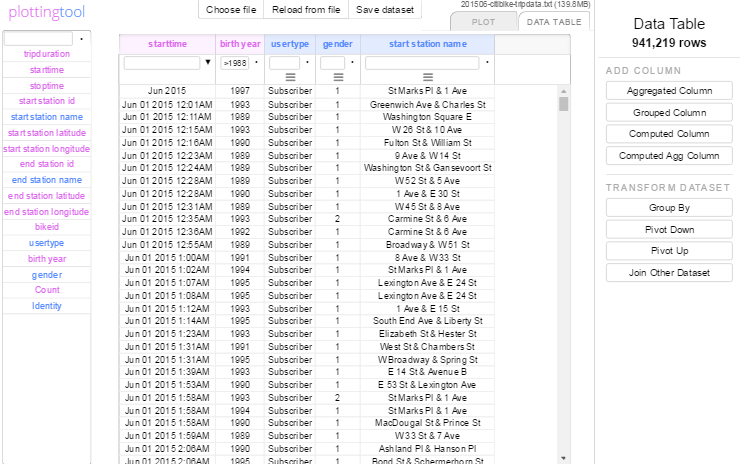
Use the table view to inspect and edit your dataset in both raw and aggregated form. Quickly add derived columns, pivot the dataset up or down, or join another dataset.
Save your final plot to our servers and embed it on your website, or download the plot and host it yourself.